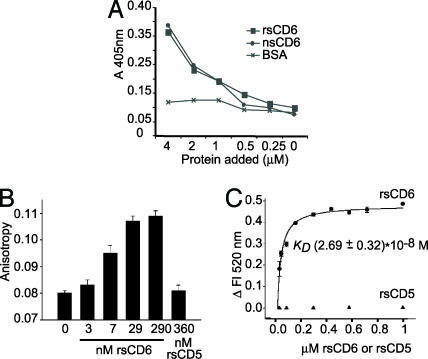
Fig. 3.
Binding of rsCD6 to LPS. (A) ELISA showing direct binding of nsCD6 and rsCD6 to LPS. Several concentrations of biotinylated rsCD6, nsCD6, or BSA (as negative control) were added to the LPS-coated wells, and bound protein was detected with streptavidin–HRP. (B and C) Binding of rsCD6 or rsCD5 to Re-LPS was monitored by changes in FITC–Re-LPS fluorescent properties. (B) rsCD6, but not rsCD5, induces a significant increase in fluorescence anisotropy upon binding to FITC–Re-LPS, which increases with increasing rsCD6 concentration. (C) Net change in fluorescence emission intensity of FITC–Re-LPS at 520 nm upon addition of increasing amounts of rsCD6 or rsCD5. The apparent Kd for FITC–Re-LPS/sCD6 complexes, calculated from the saturation curve fitted to a rectangular hyperbola, was 2.69 ± 0.32 × 10⁻⁸ M.

