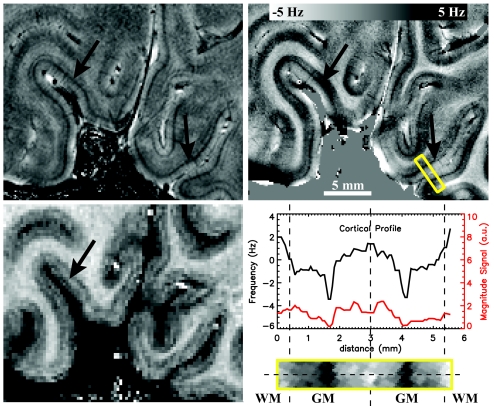
Fig. 4.
Intracortical contrast in the primary visual cortex. In the GRE magnitude image (Left Upper) and phase image (Right Upper), a darkening is observed in the central layers of the cortex, resembling the stria of Gennari (black arrow). Intensity profiles along a single projection through the cortex (dotted line in zoomed area outlined by yellow box) show that this area is ≈150–250 μm wide (Right Lower). Note the superior CNR of the phase data compared with the magnitude data (all GRE data are displayed at identical noise levels). The observed frequency difference between central GM and WM reaches ≈6.0 Hz. Regions with central darkening in phase show a faint brightening in the MPRAGE image (Left Lower).

