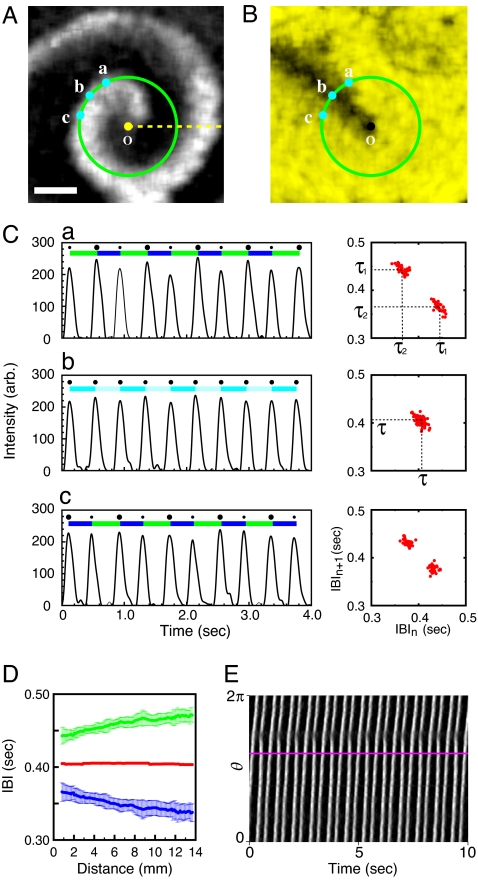
Fig. 1.
p-2 oscillatory cardiac reentry having a line defect in confluent layer of rat ventricular cells (125.00 h in vitro; cell density: 2.8 × 10³ cells per mm2). (A) Enhanced image acquired through phase-contrast optics. The gray value reflects the degree of contraction (or relaxation). (B) Pseudocolor image visualizing the local periodicity measure ΔV(r,t) for the reentry presented in A. The larger (or brighter yellow) the value of ΔV is, the further the system is away from p-1 dynamics (ΔV = 0, or black). (C) The local time series acquired at a, b, and c, as marked in A and the corresponding return maps of IBI sequences. (D) Variation of τ1 and τ2 as a function of the distance from the reentry core along the yellow dashed line in A. (E) Space–time plot confirming the static nature of the associated line defect. Here, the 1D space refers to the green circular loop centered at o in A. The superimposed purple line in E is the trace of the crossing point at which the line defect intersects the circular loop. See [supporting information (SI) Movie 1]. (Scale bar: 6 mm.)

