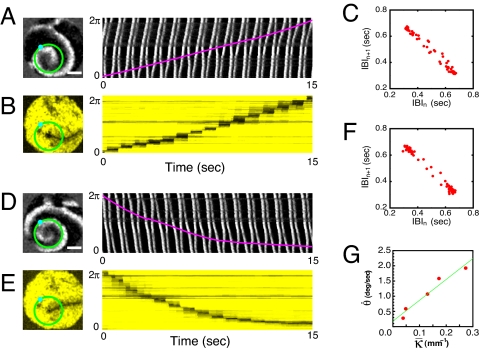
Fig. 2.
p-2 reentries having a rotating line defect. (A) Enhanced phase-contrast snapshot image and 1D space-time plot along the superimposed green circular loop. The culture is t = 114.50 h in vitro. The cell density is 2.3 × 10³ cells per mm2. (B) Pseudocolor image visualizing the underlying line defect of the reentry presented in A and 1D space-time activity along the same circular loop. (C) Return map of IBI sequence acquired at the cyan dot marked in A. (D—F) Similar set of images as in A–C but obtained at t = 114.00 h. Note that the chirality of the reentry is reversed. (G) Angular velocity of the line defect (shown in E) versus its mean overall curvature. See SI Movie 2. (Scale bars: 6 mm.)

