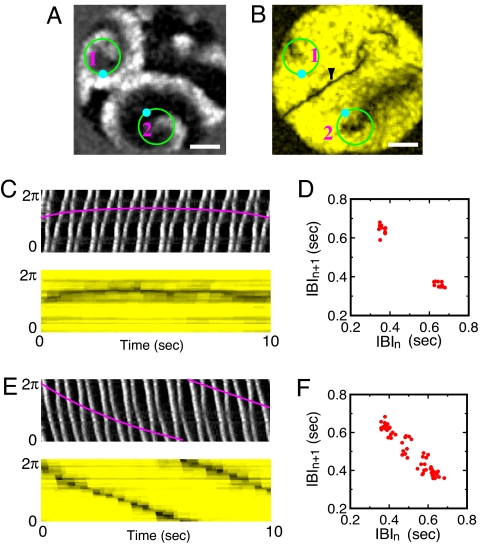
Fig. 3.
Snapshot image showing a pair of p-2 cardiac spiral waves (A) and the underlying structure of line defects (B): one marked by 1 has a static line defect (C and D), whereas the other one marked by 2 has a rotating line defect (E and F). This coexisting state was observed 75 min earlier than Fig. 2A in the same cultured tissue. The thin black line marked by the black arrow in B is a shock boundary where two wave fronts annihilate [i.e., V(r⃗,t) = 0]. See SI Movie 3. (Scale bars: 6 mm.)

