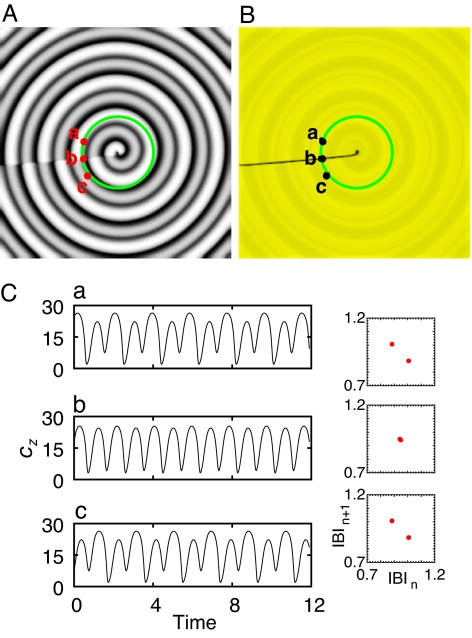
Fig. 4.
Single p-2 oscillatory spiral wave in a model reaction-diffusion system. (A) Gray-scale snapshot image visualizing the scalar field CZ. (B) A processed image revealing the underlying line defect (black line) of A. The image rendering scheme is the same as in Fig. 1B. (C) Local time series acquired at the positions a, b, and c marked in A and the corresponding return maps of IBIs. The values of rate constants are: κ1 = 31.2, κ−1 = 0.2, κ2 = 1.50, κ−2 = 0.1, κ3 = 10.8, κ−3 = 0.12, κ4 = 1.02, κ−4 = 0.01, κ5 = 16.5, and κ−5 = 0.5. Numerical simulations are conducted with a forward Euler method (DΔt/Δx2 = 2 × 10⁴) in a 512 × 512 grids using no flux boundary condition.

