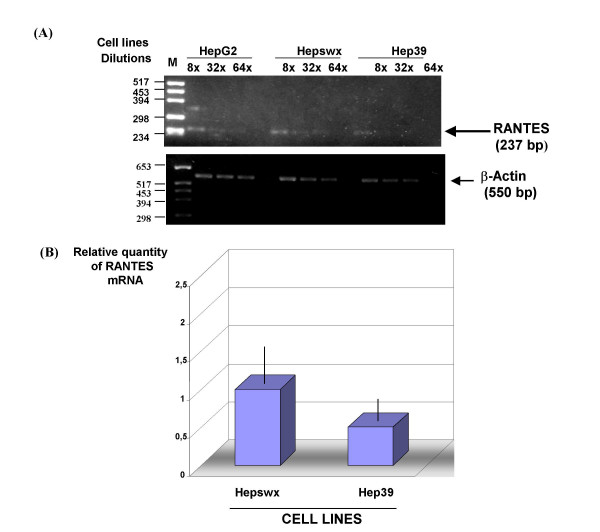
Figure 3.

Quantitative RT PCR analysis of RANTES mRNA. (A) Serial dilution of cDNA samples (1:8, 1:32, 1:64 indicated as 8×, 32×, 64×) were prepared and subjected to PCR amplification. Lower panel shows β-actin mRNA amplification which was used as endogenous control. (B) Real-Time quantitative PCR analysis using RANTES primers. Data were normalized by the level of β2-microglobulin mRNA expression in each sample and are shown as the relative expression unit. Shown are the means ± standard deviations of two independent experiments with three replicates/sample in each experiment.
