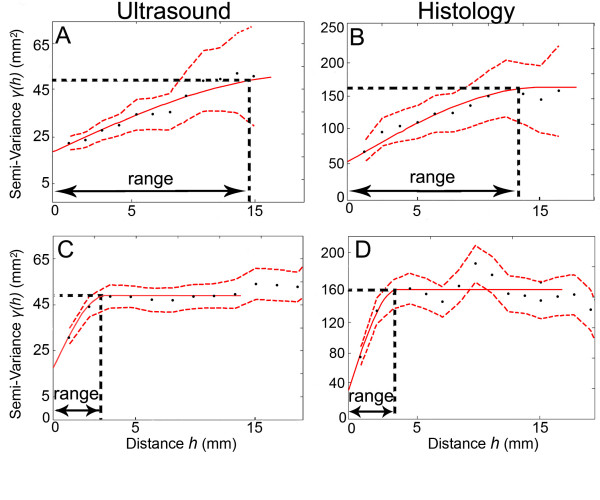
Figure 3.
A, B: Example of semi-variogram plots calculated in the direction parallel to the skin from one matched pair of ultrasound (A) and histology (B) images (corresponding to the single ultrasound and histology images shown in Figure 2 A, B). C, D: Semi-variogram plots for the same two images calculated in the direction perpendicular to the skin. γ(h) is the semi-variance of pixel intensity for pairs of pixels separated by a given distance (h) (see methods). Solid red lines represent fitted experimental semi-variograms. Dashed red lines represent 95% confidence limits.

