
Figure 6.
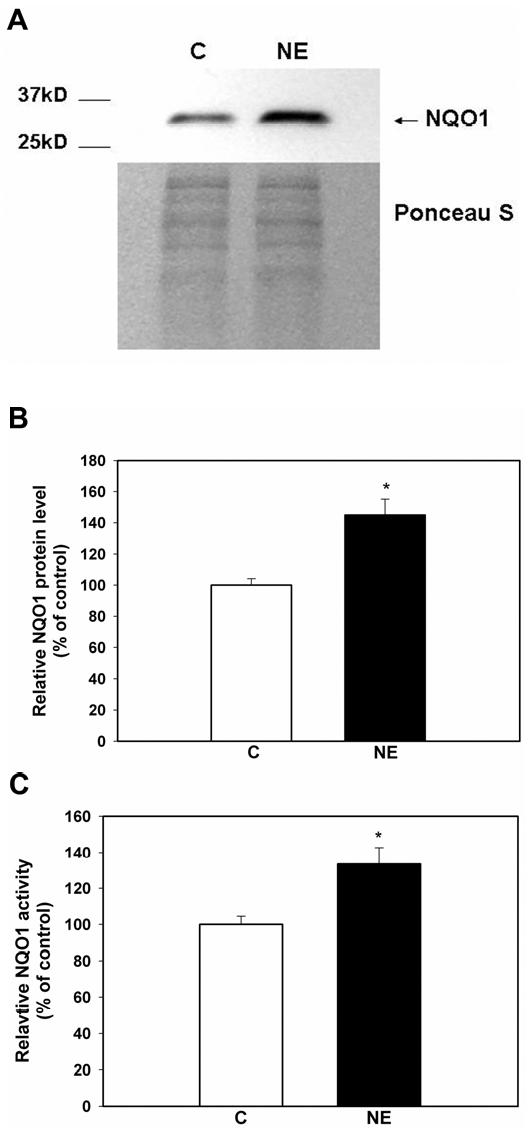
NE increased NQO1 protein and activity level in A549 whole cell lysates. Whole cell lysates of A549 cells following treatment with NE (100nM, 1h) or control vehicle (C) were evaluated for NQO1 protein levels by western blot (A). The graph summarizes the densitometry data of NQO1 protein level normalized to Ponceau S staining. Results are expressed as a percent of control, mean ± SEM (n=10, 4 separate experiments). *, significantly different from control (P= 0.0002) (B). NQO1 activity in whole cell lysate was evaluated using a spectrophotometric assay measuring the reduction of DCPIP at 600 nm. Relative NQO1 activity was expressed as a percent of control, mean ± SEM (n=10, 4 separate experiments). *, significantly different from control (P = 0.0022) (C).