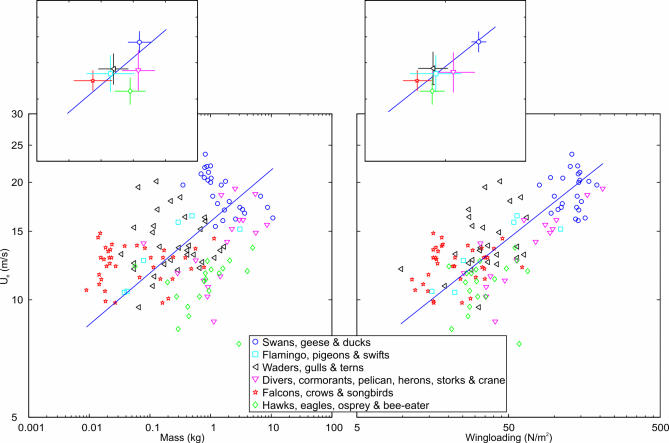
Figure 1. Bird Flight Speeds (U e; m/s) Plotted in Relation to Body Mass (kg) and Wing Loading (N/m2) for 138 Species of Six Main Monophyletic Groups.
The lines show the scaling relationships U e = 15.9 × (mass)0.13 and U e = 4.3 × (wing loading)0.31 as calculated by reduced major axis regression for all species (Table 1). All axes are in logarithmic scale. Inserts show means (± standard deviations) for the six main phylogenetic groups in relation to these scaling lines. Species of the same group tend to fly at similar speeds, and phylogenetic group is an important factor to account for the variation in U e.

