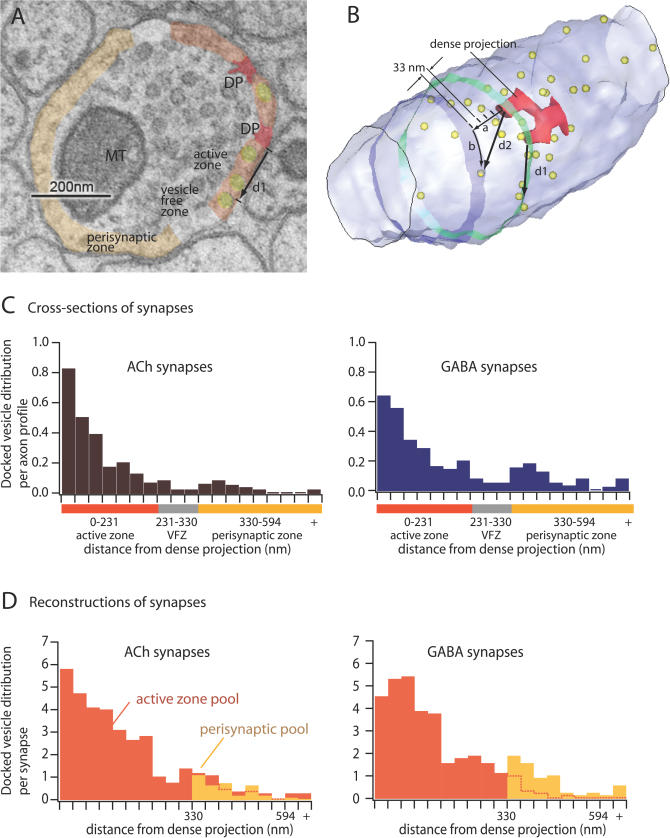
Figure 2. Docking in C. elegans Occurs in Two Zones.
(A) Shown is a sample electron micrograph from a wild-type animal showing a single VA motor neuron profile in the ventral nerve cord. This profile contains a dense projection (DP), shown in red, which is divided in two in this profile. The membrane region within 231 nm of the dense projection (active zone) is shown in orange, the region from 232–330 nm (VFZ, vesicle-free zone) is light gray, and the region farther than 330 nm from the dense projection (perisynaptic zone) is amber. Yellow, docked synaptic vesicles. MT, mitochondria. The linear distance from the edge of each docked vesicle to the edge of the dense projection was measured (d1).
(B) Shown is a reconstruction of a sample VA motor neuron synapse from 38 serial electron micrographs. The plasma membrane (light blue), dense projection (red), and docked vesicles (yellow) are shown. Two single sections are represented by blue and green bands. The green section contains the dense projection and is the image shown in (A). The blue section illustrates the calculation of the distance d2 for docked vesicles in sections without a dense projection. This distance was calculated from the number of 33-nm sections between the vesicle and the dense projection (a) and the radial distance from an imaginary extension of the dense projection to the vesicle (b).
(C) Distribution of all docked vesicles in sections containing a dense projection for acetylcholine and GABA neurons. Distances were sorted into 33-nm bins, and the number of measurements in each bin divided by the total number of sections. Data in this analysis are from four wild-type animals comprising 30 synapses and 140 profiles (acetylcholine) and 21 synapses and 100 profiles (GABA). As in (A) the active zone is shown in orange, the region from 232–330 nm (vesicle-free zone) is light gray, and the region farther than 330 nm from the dense projection (perisynaptic zone) is amber.
(D) Shown is the distribution of all vesicles in reconstructed synapses for acetylcholine and GABA neurons. Distances were calculated as described above and sorted into 33-nm bins with respect to the distance from the dense projection. For those vesicles in sections not containing dense projections sorting was done based on a tube model of the synapse. Specifically, vesicles were considered in the active zone pool if they were docked within an imaginary stripe extending the length of the tube of a width of 231 nm on either side of the dense projection; these vesicles are indicated in orange. All vesicles not in this stripe, that is those on the far side of the tube, were considered in the perisynaptic zone; these vesicles are indicated in amber. Data in this analysis are from two wild-type animals comprising 11 synapses and 136 profiles (acetylcholine) and nine synapses and 168 profiles (GABA).

