
Figure 5.
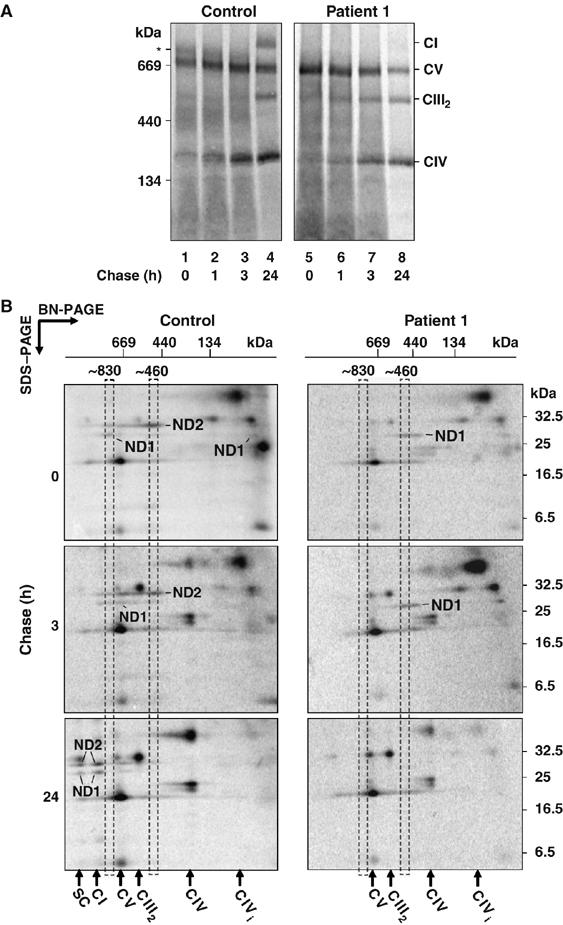
Complex I assembly is impaired in patient 1 cells. (A) After radiolabeling of mtDNA-encoded subunits, control or patient 1 fibroblasts were chased for various times as indicated. Mitochondria were isolated, solubilized in Triton X-100 and subjected to BN-PAGE followed by phosphorimage analysis. CI, CIII2, CIV and CV are indicated. The asterisk (*) denotes the ∼830 kDa intermediate complex. (B) 2D-PAGE analysis of radiolabeled mtDNA-encoded subunits from both control (left panels) and patient 1 (right panels) fibroblasts at different chase times. Mitochondria were isolated, solubilized in Triton X-100 and subjected to BN-PAGE in the first dimension, followed by SDS–PAGE in the second dimension and phosphorimager analysis. Positions of the ∼460 and ∼830 kDa assembly intermediates and the respiratory chain complexes are shown. The positions of ND1 and ND2 are indicated. CI=complex I, CV=complex V, CIII2=complex III dimer, CIV=complex IV, CIVi=complex CIV intermediate, SC=CI/CIII2 supercomplex.