Figure 1.

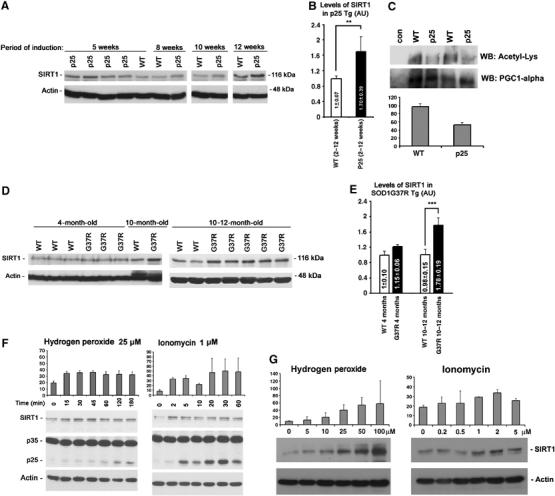
Upregulation of SIRT1 in mouse models displaying progressive and severe neurodegeneration. (A) Upregulation of SIRT1 in p25 transgenic mice during progressive neurodegeneration (after 2–12 weeks of induction). (B) Quantifications of levels of SIRT1 in p25 transgenic mice. **P(T⩽t) two tails: 0.007. (C) Acetylation levels of PCG-1alpha is decreased in forebrains of p25 transgenic mice (10–12 weeks of induction). Densitometry-based analyses of acetylated PCG-1alpha levels is shown in the lower panel. (D) Progressive increase of SIRT1 in mutant SOD1G37R (line 29) peaking at stage of massive neurodegeneration (10–12 months). (E) Quantifications of levels of SIRT1 in SOD1G37R mice. ***P(T⩽t) two tails: 0.0004. (F) Treatment of primary cortical neurons with low concentrations of ionomycin (1 μM) and H2O2 (25 μM) induces rapid upregulation of SIRT1 associated with generation of p25. Time expressed in minutes. Top panels show densitometry-based analyses of SIRT1 levels. (G) Treatment of primary cortical neurons with increasing doses of ionomycin or H2O2 for 20 min demonstrates a dose-dependent induction of SIRT1 by these neurotoxic stimuli. Top panels show densitometry-based analyses of SIRT1 levels.
