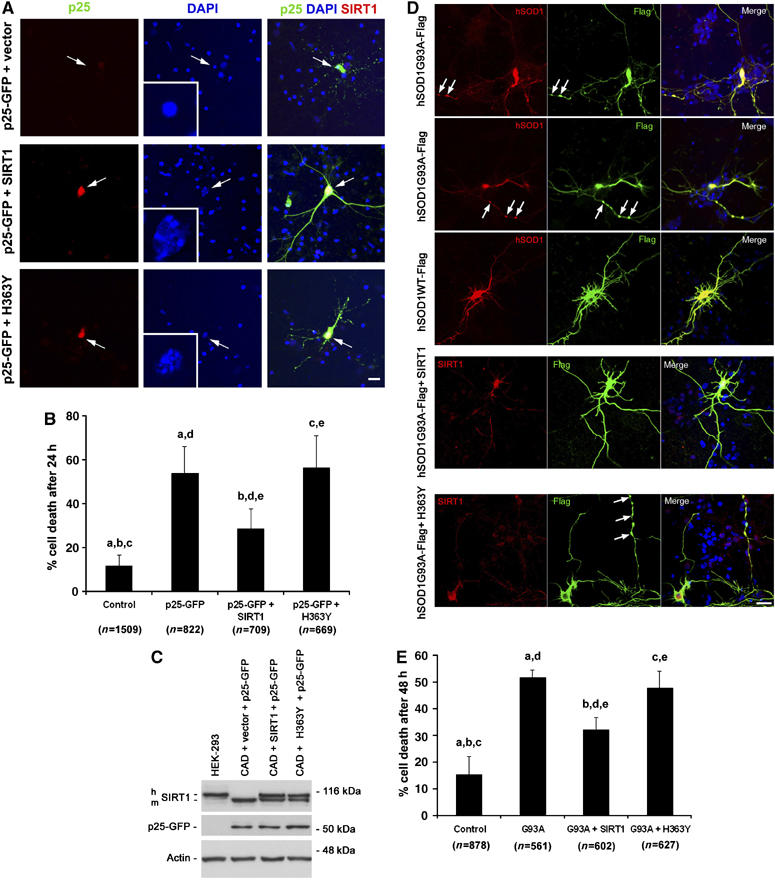
Figure 3.

Overexpression of SIRT1 protects against p25 and mutant SOD1 toxicity. (A) Effects of overexpression of SIRT1 or SIRT1 lacking catalytic deacetylase activity (H363Y) on p25 GFP toxicity. Arrows indicate neurons transfected with p25-GFP with or without SIRT1 (red). Inset in DAPI-only panel is a magnification of the nucleus of the transfected neuron, as indicated by arrow. Scale bar, 20 μm. (B) Quantifications of cell death in p25-GFP expressing neurons with or without ectopic expression of SIRT1 or H363Y. a, control versus p25-GFP, P<0.001; b, control versus p25-GFP+SIRT1, P<0.05; c, control versus p25-GFP+H363Y, P<0.001; d, p25-GFP versus p25-GFP+SIRT1, P<0.01; e, p25-GFP+SIRT1 versus p25-GFP+H363Y, P<0.01. p25-GFP versus P25GFP+H363Y is non-significant (P>0.05). One-way ANOVA with Neuman–Keuls Multiple Comparison Test. (C) Unchanged levels of p25-GFP following expression of SIRT1 or H363Y. h, human; m, mouse. Comparison of HEK and CAD cells for SIRT1 expression. (D) Effects of overexpression of SIRT1 or H363Y on SOD1G93A toxicity. Arrows indicate to SOD1 aggregates as detected with FLAG Ab. WT SOD1 is not toxic. Scale bar, 25 μm. (E) Quantifications of cell death in SOD193A and WT SOD1-expressing neurons with or without ectopic expression of SIRT1 or H363Y. a, control versus G93A, P<0.001; b, control versus G93A+SIRT1, P<0.001; c, control versus G93A+H363Y, P<0.001; d, G93A versus G93A+SIRT1, P<0.001; e, G93A+SIRT1 versus G93A+H363Y, P<0.001. G93A versus G93A+H363Y is non-significant (P>0.05). One-way ANOVA with Neuman–Keuls Multiple Comparison Test.
