Figure 6.

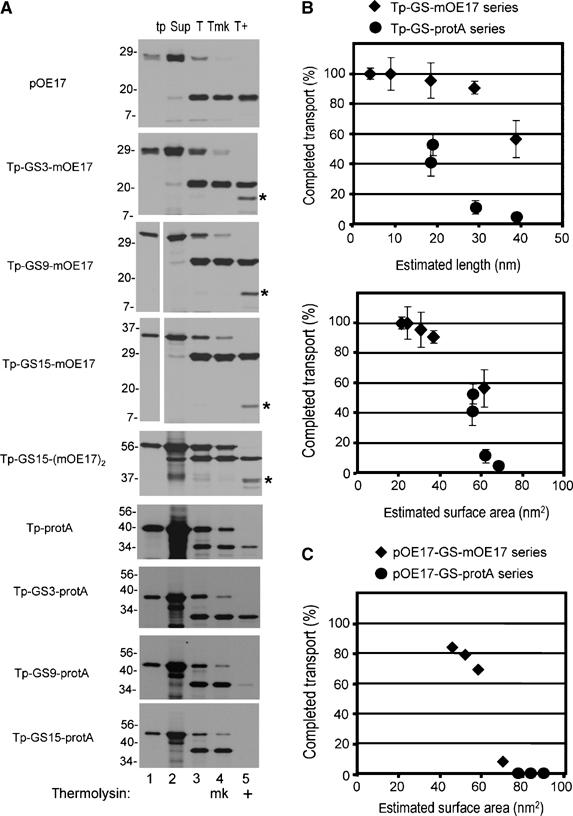
Translocation completion as related to estimated substrate dimensions. (A) Example of transport assays used to calculate the percentage of completed translocation. Precursors were assayed for transport with washed thylakoids (Materials and methods), except that assays were 100 μl final volume and contained thylakoids equivalent to 50 μg chlorophyll. Thylakoids were recovered by centrifugation, the supernatant removed (Sup, lane 2), and the thylakoids analyzed directly (T, lane 3), mock treated (Tmk, lane 4), or treated with thermolysin (T+, lane 5). Translation products (tp, lane 1) represent 10% of the assay and all other samples 100%. (B) The percentage of completed transport was calculated from the amount of protease-protected processed substrate in lane 5 (e.g., m-GS-OE17 or m-GS-protA), compared to the processed substrate in lane 4 in panel A. This was plotted against the estimated length of the substrate (upper plot), or the estimated surface area (lower plot). The data are the means and standard error of the mean for three independent experiments, in which all substrates shown in panel A were assayed in parallel transport reactions (Supplementary Tables 1 and 2). The lengths used were as follows: OE17, 4.5 nm; protein A, 14 nm; and the GGGGS linkers, 0.33 nm per residue. Surface area was estimated as the surface of cylinders with the diameter of OE17 as 1.5 nm, protein A as 1.2 nm, and the GGGGS linker as 0.2 nm. (C) Plot of estimated surface area versus the percentage of completed transport of the pOE17-GS-X series in the experiment shown in Figure 5.
