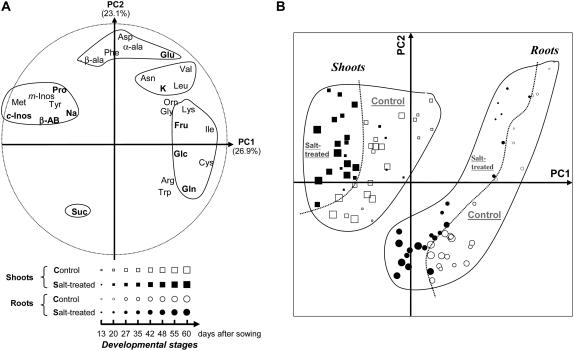
Figure 4.
PCA showing the pattern of the metabolic phenotype changes in shoots and roots of L. latifolium seedlings during acclimatization to saline or nonsaline condition. Six-day-old seedlings were divided in two sets and each grown hydroponically for 54 d in presence of either 100 mm NaCl or the nonsaline reference medium. Three individuals were collected from each of the salt-treated set (indicated by black symbols) and the reference set (indicated by white symbols) at eight different developmental stages (indicated by symbols with increasing sizes from 13–60 d after sowing). Shoots (indicated in the diagram by squares) and roots (indicated by circles) of each sample were separately analyzed for 27 solute contents (including Na+ and K+). Presented are the results generated by the PCA analysis of 96 shoot and root samples based on 27 of their variable solute contents. The first two PCs cover 50% of the total variation (PC1: 26.9%; PC2: 23.1%). The symbols used to represent the different saline versus nonsaline treatments, shoots versus roots parts of the seedlings, and the successive developmental stages are summarized in the legends. The loading of the variable solutes in the two first PCs is presented in A, whereas B shows the plot of the 96 samples in the same two first axes. The most remarkable solutes are indicated in bold in A.

