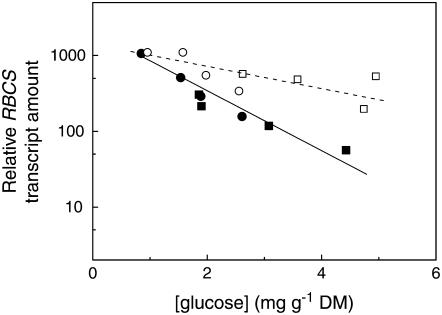
Figure 3.
Relationship between transcript levels of RBCS relative to the control gene (Act66) and leaf Glc concentrations per unit dry weight in wild type (white symbols, dashed line) and ethylene-insensitive tobacco (black symbols, solid line) treated for 9 d with CO2 concentrations of 400 (circles) or 800 (squares) μmol mol−1. Each point is the observation for one plant. Samples were taken just before the start of the light period. Correction with another control gene (L25) gave similar results. The interaction between genotype and Glc concentration was tested in an ANCOVA and significant at P < 0.01.

