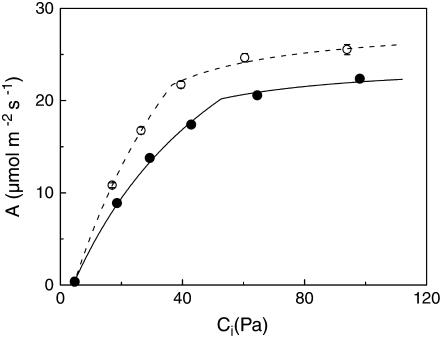
Figure 5.
CO2 response curves of the rates of net photosynthesis in wild-type (white symbols, dashed lines) and ethylene-insensitive (black symbols, solid lines) tobacco. Lines were calculated using the biochemical model of Farquhar and von Caemmerer (1982). Mean values ± se (n = 8). Error bars are generally smaller than the symbol.

