Figure 5.
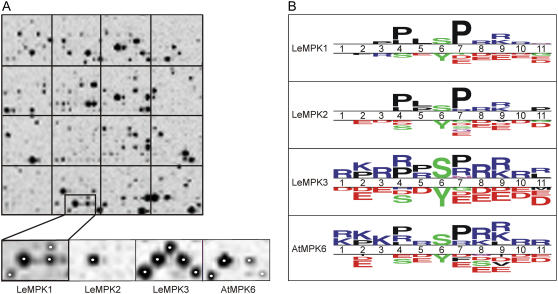
PepChips reveal different phosphorylation patterns for LeMPK1, LeMPK2, and LeMPK3. PepChips were incubated with rMAPKs in the presence of radiolabeled ATP. A, Peptides phosphorylated on the PepChips were visualized with phosphor imaging. The top image shows one of the triplicate sets of peptides phosphorylated by rLeMPK1, whereas the bottom images show a subset of peptides differentially phosphorylated by rLeMPK1, rLeMPK2, rLeMPK3, and rAtMPK6, respectively. Spots marked by a white dot are represented in the selected subset of phosphorylated peptides presented in B. B, Selected phosphorylated and nonphosphorylated peptides were compared with TSL software. Putative phosphorylation sites (Ser [S], Thr [T], or Tyr [Y]) are aligned on position 6, and above the double line the TSL plots show for positions 1 to 11 whether a particular amino acid residue has an increased frequency in the phosphorylated peptides compared to the same position in the nonphosphorylated peptides. For the latter, the most frequently occurring residues are depicted below the double line (t test, P < 0.05). The size of the symbols is proportional to the relative frequencies of the residues in the phosphorylated and nonphosphorylated peptides. The largest (stack of) symbols in the TSL plots for rLeMPK1, rLeMPK2, rLeMPK3, and rAtMPK6 have a frequency of 62%, 58%, 34%, and 34%, respectively. L, Leu; R, Arg; K, Lys; D, Asp; E, Glu; F, Phe; V, Val; P, Pro.

