Figure 4.
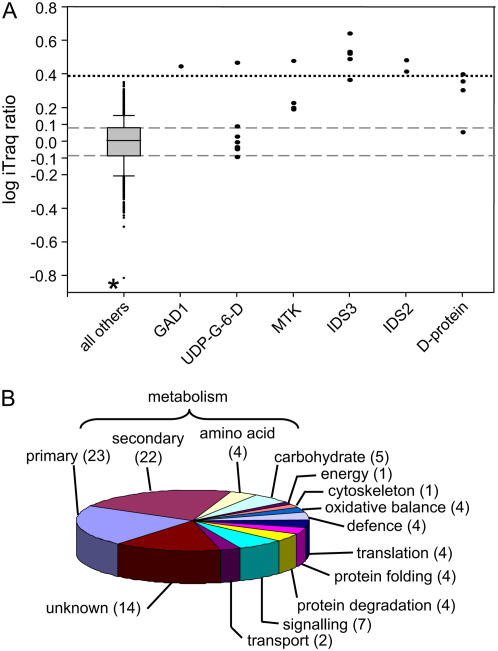
Relative abundance and identity of proteins identified in B-tolerant and B-intolerant plants. A, Box plots showing distribution of log-transformed iTRAQ peptide ratios derived from proteins isolated from the roots of B-tolerant and B-intolerant bulked segregants. All 1,038 peptides with iTRAQ ratios are represented in this segment. Positive values (in segment B) indicate an increase in peptide/protein abundance in the B-tolerant plants. Box defines the 25th and 75th percentiles of the population. Error bars define 10th and 90th percentiles of the population. Asterisk indicates extreme outlying values discussed in text. Dashed lines indicate values less than 0.25-fold different between samples. Dotted line indicates 2.5-fold significant difference between samples. GAD1, TC131033; UDP-G-6-D, UDP-Glc-6-dehydrogenase (TC138934); MTK, TC140103; IDS3, TC142112; IDS2 (TC137786); D-protein (TC134738). B, Pie chart showing the functional classification of the 341 proteins identified in this analysis. Numbers in brackets indicate the percentage of proteins that are present in each category. [See online article for color version of this figure.]

