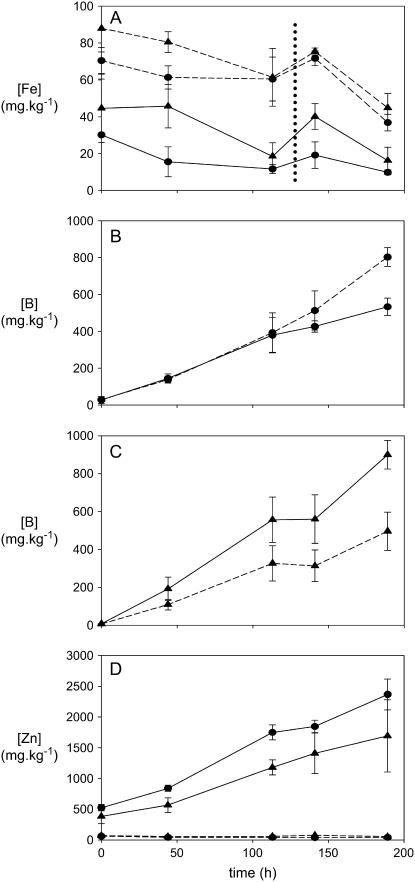
Figure 5.
Inductively coupled plasma analysis of elemental abundance in barley leaves from B-tolerant (‘Sahara’) and B-intolerant (‘Clipper’) plants. A, Fe concentrations in the youngest leaves. B, Accumulation of B in the oldest leaf of ‘Clipper.’ C, Accumulation of B in the oldest leaf of ‘Sahara’ plants. D, Zn accumulation in oldest leaves. Circles, ‘Clipper’ plants; triangles, ‘Sahara.’ Dashed lines, Fe-replete plants; solid lines, Fe-deficient plants. Dotted vertical line in A indicates emergence of fourth (new) leaf. Error bars indicate sd (n = 3).

