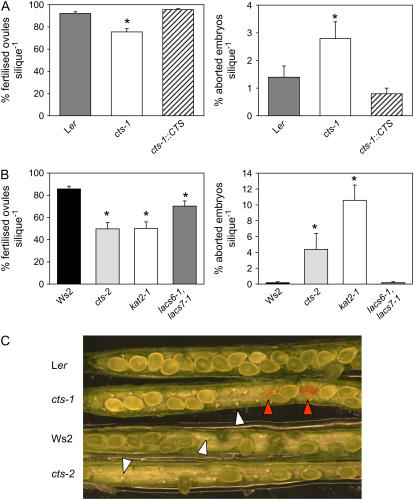
Figure 3.
Fertilization in cts mutants. A, Percentage fertilized ovules and aborted embryos in siliques of Ler, cts-1, and cts-1 plants transformed with a CTS promoter-cDNA cassette (cts-1∷CTS). Siliques were harvested 10 DAF. Values are means ± se (n = 10–15 siliques). B, Percentage fertilized ovules and aborted embryos in siliques of wild type, Ws2, and β-oxidation mutant alleles: cts-2, kat2-1, lacs6-1,lacs7-1. The Ws4 wild-type behaved identically to Ws2 (data not shown). Values are means ± se (n = 11–18 siliques). Asterisks in A and B denote significant differences to wild type at 5%, as determined following ANOVA, using the lsds on the transformed data. C, Dissected siliques (harvested 10 DAF) showing unfertilized ovules (white arrowheads) and aborted embryos (red arrowheads) in cts mutants.

