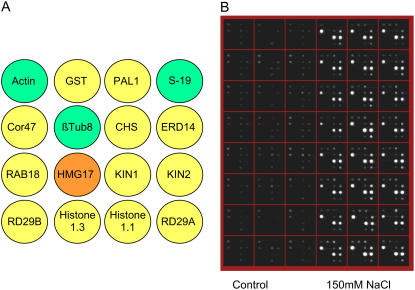
Figure 2.
Layout of the microarrays within the ArrayPlate wells after programming to detect 16 specific transcripts. A, Green circles contain control housekeeping genes used to normalize the data, the orange circle contains a human gene used as a negative control (which should never provide a signal), and yellow circles represent test genes. B, Image of chemiluminescence emission captured at the positions of the array elements. Analysis was done of transcripts in homogenates from plants following treatment with 150 mm NaCl or the corresponding water control.

