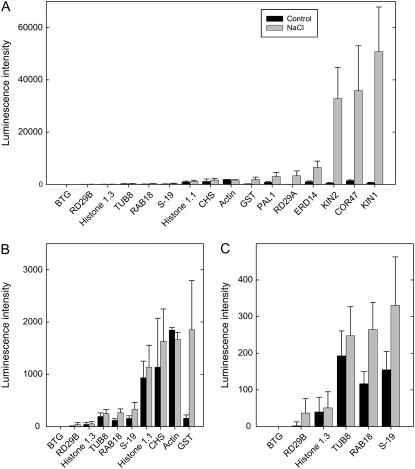
Figure 3.
Graphic analysis of data extracted from the image shown in Figure 2. The intensity values are means (n = 24; one plant per well), normalized to the levels of the transcripts of both actin and S-19 as housekeeping genes (the averaged normalized value is 1,000), with sds depicted by the error bars. A, Data for all transcripts. B, Figure rescaled to accommodate transcripts at medium levels. C, Figure rescaled to accommodate transcripts at low levels.

