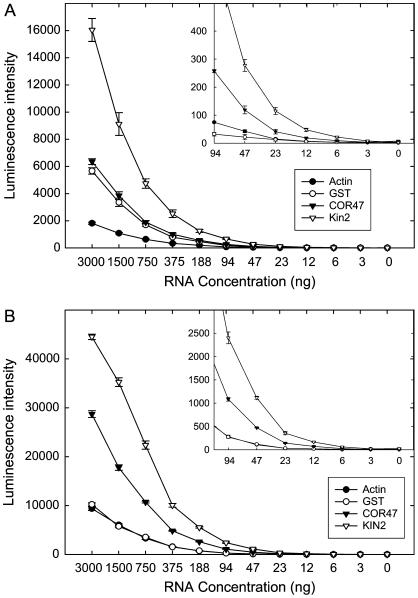
Figure 4.
Analysis of the sensitivity of the qNPA assay platform as indicated by a dilution series. A, Total RNA purified from 10-d-old Arabidopsis plants grown in soil and treated for 24 h with 150 mm NaCl. The inset is the same figure, but rescaled to show the response at lower RNA concentrations. B, Lysate extracted from 10-d-old Arabidopsis plants grown in soil and treated for 24 h with 150 mm NaCl. Each data point is the mean of quadruplicate samples and the error bars indicate ses. Data are not normalized. Only the results of the transcripts from a control gene (actin) and four NaCl-stimulated genes (KIN1, KIN2, COR47, and GST) are shown. RNA concentrations indicated on the abscissa of B are estimated based on the data from A.

