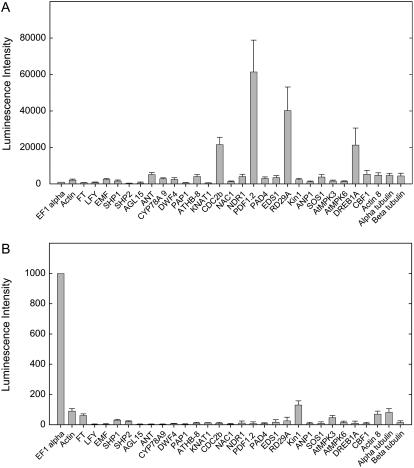
Figure 7.
Analysis of transcript levels in seeds and siliques. A, Twenty to 30 dry seeds were placed in each well and homogenized in lysis buffer. The experiment was repeated eight times and means and sds (error bars) normalized to EF-1α levels are presented. B, One silique was placed in each well prior to homogenization. The experiment was repeated eight times and means and sds (error bars) normalized to EF-1α levels are presented.

