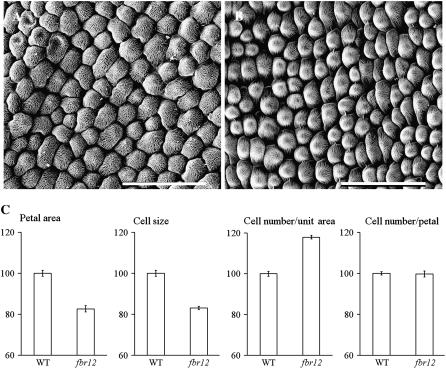
Figure 6.
Reduced cell numbers in fbr12 petals. A and B, Scanning electron microscopy of wild-type (A) and fbr12 (B) petals. Compared to that of the wild type, the fbr12 petals have smaller cells. Bar = 100 μm. C, Defective cell growth in fbr12 petals. In each image, the average values of the wild type (obtained by analyzing 20 petals derived from nine flowers) were set at 100% and the values of fbr12 relative to those of the wild type were given in the histogram. Bars = ses.

