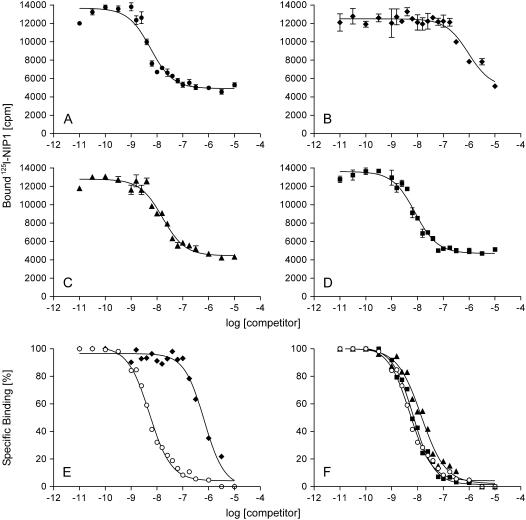
Figure 4.
Competition for 125I-NIP1 binding to barley microsomal membranes with different variants of unlabeled NIP1 as competitors. A, Type I. B, Type II. C, Type III*. D, Type IV*. All samples were taken from the same experiment. All data points represent the average of three independent measurements. E and F show normalized competition curves for type I (○) and type II (♦, compare with A and B) and for type I (○), type III* (▴), and type IV* (▪; compare with A, C, and D), respectively. For transparency reasons, the error bars are not shown in E and F.

