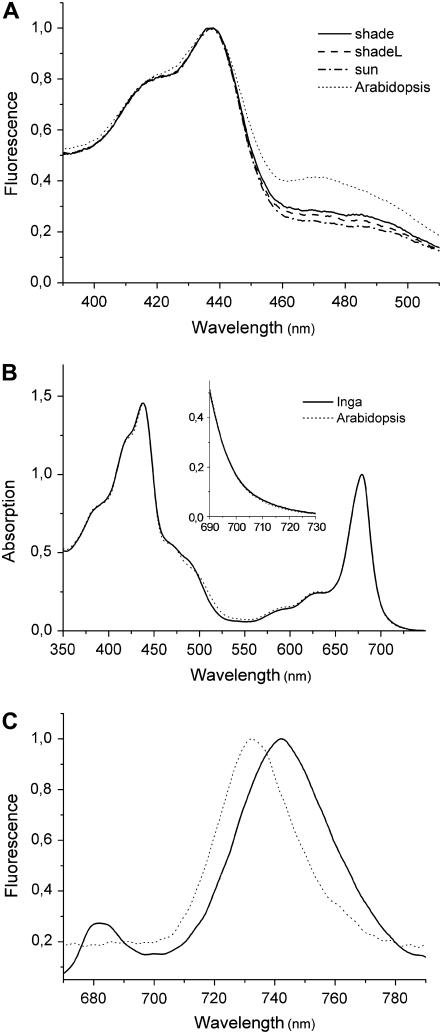
Figure 3.
Spectral characteristics of the PSI-LHCI fractions (band 6b). A, Comparison of the room-temperature fluorescence excitation spectra of shade (solid line), shadeL (dashed line), and sun (dash-dotted line) for I. sapindoides as well as Arabidopsis (dotted line). Fluorescence was detected at 685 nm. Data were normalized to the maximum. B, Room-temperature absorption spectra of I. sapindoides (solid line, only the data from shade are shown) and Arabidopsis (dotted line). The inset shows a closeup of the spectral region between 690 and 730 nm. Data were normalized to the maximum in the Qy region. C, Low-temperature fluorescence emission spectra of I. sapindoides (solid line) and Arabidopsis (dotted line). Spectra were measured with an excitation wavelength of 475 nm. Data were normalized to the maximum. Pigment composition of these samples (except for Arabidopsis) is given in Table III.

