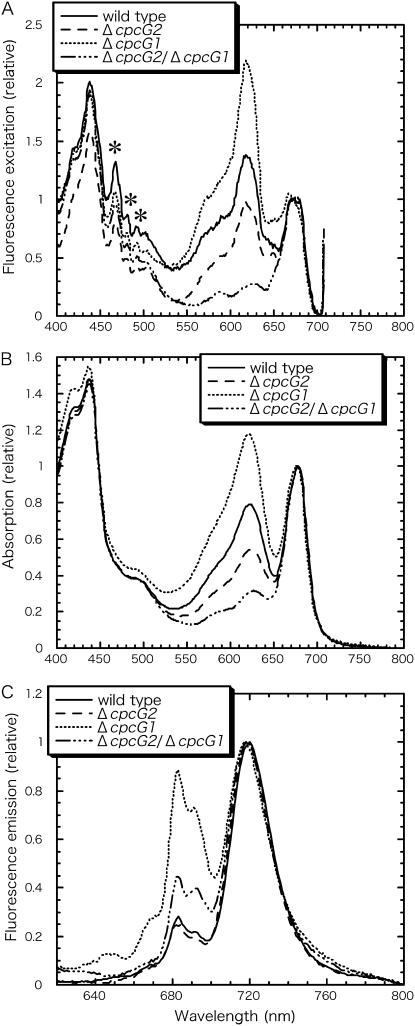
Figure 3.
77 K fluorescence spectra (A and C) and absorption spectra (B) of thylakoid fractions P1. A, The excitation spectra were normalized to the chlorophyll peak at 673 nm. PSI fluorescence was measured at 718 nm. Asterisks indicate artificial peaks derived from a Xenon light source. B, The absorption spectra were normalized to chlorophyll peak at 678 nm. C, Emission spectra excited upon 435 nm were normalized to PSI fluorescence peak at 721 nm.

