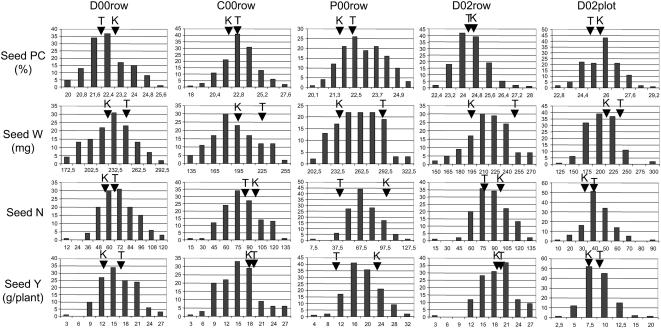
Figure 2.
Frequency distribution of the seed protein content, seed weight, seed number, and seed yield of the ‘Térèse’ × K586 recombinant inbred population in the five field trials: n = 2; Dijon, France (2000) one-row trial, D00row; Dijon, France (2002) one-row trial, D02row; Dijon, France (2002) plot trial, D02plot; Chartainvilliers, France (2000) one-row trial, C00row; Premesques, France (2000) one-row trial, P00row. The arrowheads indicate the mean value of the parental lines. K, K586; T, ‘Térèse’.

