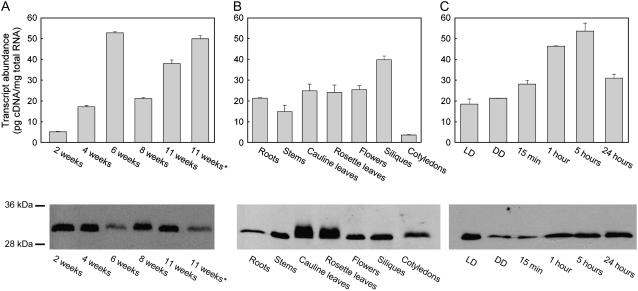
Figure 2.
Expression analysis of PDX2. The top segment shows transcript abundance of PDX2. A, Rosette leaves of 2-, 4-, 6-, 8-, and 11-week-old plants. The asterisk indicates senescent leaves of 11-week-old plants. B, Roots, stems, cauline leaves, rosette leaves, flowers, siliques, and cotyledons. C, Five-day-old etiolated seedlings 15 min and 1, 5, and 24 h after transfer to light, as well as long-day (LD; 16 h of light/8 h dark) and continuous dark (DD) controls. All values are presented as pg cDNA/mg total RNA. For absolute amounts of mRNA, standard curves were generated using known concentrations of a plasmid carrying the PDX2 gene. Plasmid DNA was diluted to 1 ng μL−1 followed by 10-fold serial dilutions to 1 fg μL−1. The results shown are the average of the experiment performed in triplicate. The bottom panel shows PDX2 protein abundance as assessed by an immunochemical analysis. Total protein was extracted from the same samples as described for the top panel and probed with an antibody raised and purified against the recombinant PDX2. Thirty micrograms of total protein was loaded per lane. Molecular mass standards are as indicated.

