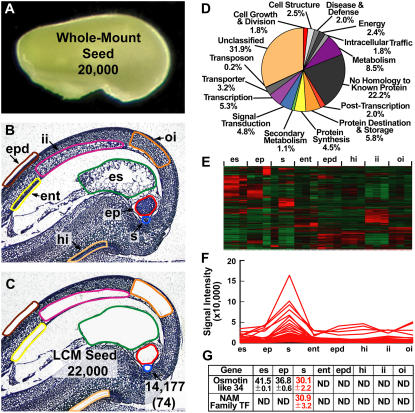
Figure 5.
Using LCM and transcriptional profiling to identify genes required to make a soybean seed. A, Globular-stage soybean seed showing the approximate number of transcripts detected in the entire seed using the Affymetrix Soybean GeneChip (Whole-Mount Seed). B and C, Globular-stage soybean seed paraffin sections before (B) and after (C) capturing the highlighted seed compartments by LCM. The approximate total number of diverse transcripts detected collectively from LCM seed compartments is shown (LCM Seed) in addition to the total number of transcripts detected in the suspensor (arrow). The number in parentheses refers to suspensor transcripts not detected in other seed compartments at the level of the GeneChip (i.e. suspensor-specific transcripts). Raw data were deposited in the Gene Expression Omnibus (GEO) as data series GSE6414 (http://www.ncbi.nlm.nih.gov/geo) and can also be accessed at http://estdb.biology.ucla.edu/seed. D, Functional category distribution of soybean suspensor transcripts detected by GeneChip analysis. E, Unsupervised hierarchical clustering of the top 2,000 most varying transcripts detected in all globular-stage seed compartments using dChip version 1.3 (Li and Wong, 2001). F, Supervised cluster analysis of suspensor developmentally regulated transcripts. G, Real-time qRT-PCR validation of suspensor-specific transcripts. Values represent the mean and sd of the threshold cycle (Ct) for two biological replicates with two technical replicates each. Ct values were adjusted to an 18S rRNA internal control. One Ct cycle represents a 2-fold difference in RNA prevalence. Lower Ct values indicate higher RNA levels. ent, Endothelium; ep, embryo proper; epd, epidermis; es, endosperm; hi, hilum; ii, inner integument; oi, outer integument; s, suspensor.

