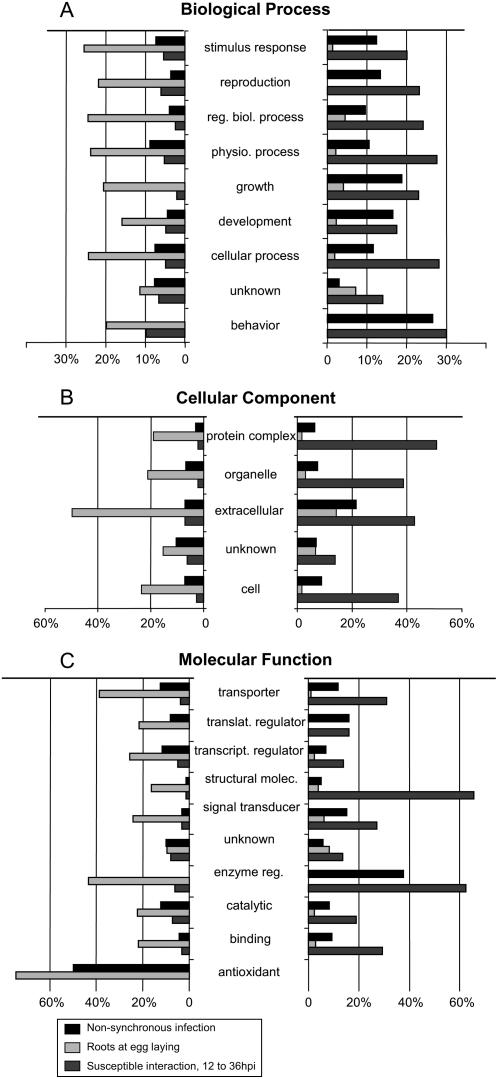
Figure 9.
Summery of expression responses of categories of genes differentially expressed in the nematode plant interaction. A, Biological Process; B, Cellular Component; C, Molecular Function. Genes were categorized based on GO annotation. Percentage indicates number of array genes in the given category that exhibit significant differential regulation. Figure design based on figure 4 in Jammes et al. (2005).

