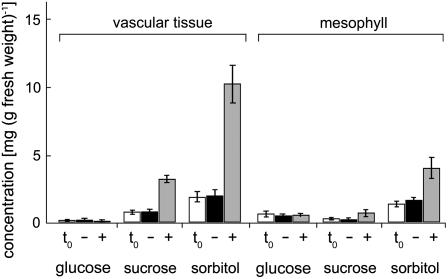
Figure 4.
Analysis of sugar (Glc and Suc) and sorbitol concentrations in enriched vascular tissue and in vascular-depleted mesophyll of Plantago plants. Bars show the concentrations of the indicated sugar or sugar alcohol and represent the average of four independent analyses (±sd). Data are presented for 0-h (t0) and 10-h (−) control plants and for 10-h NaCl-treated plants (+). For each analysis 100 mg of plant material was extracted and filtered, and the equivalent of 2 mg of fresh weight was analyzed by HPLC.

