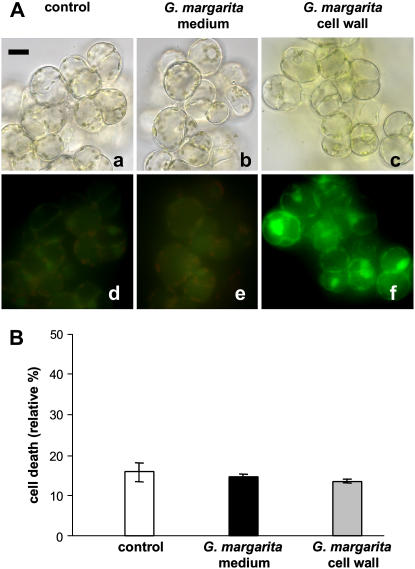
Figure 6.
Detection of intracellular ROS formation and effect on cell viability. A, Intracellular ROS were detected by 2′,7′-dichlorodihydrofluorescein diacetate staining in control cells (a and d) and after 10 min of incubation with G. margarita medium (b and e) or homogenates of the fungal spore cell wall (c and f). For each treatment, light (a, b, and c) and DCF fluorescence (d, e, and f) microscope images of the same field are reported. Bar = 10 μm. B, Cell viability was determined by the Evans blue method in control cells and cells treated for 2 h with the above fungal elicitors (white bar, control cells; black bar, cells treated with G. margarita medium; gray bar, cell treated with homogenates of the fungal spore cell wall). Data are the means ± sem of three experiments.

