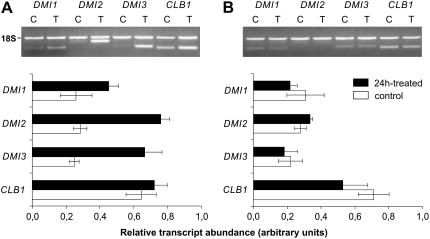
Figure 8.
Analysis of gene expression in soybean cells. Semiquantitative RT-PCR of soybean genes during control conditions (C, white bars) and after 24-h treatment (T, black bars) with G. margarita culture medium (A) for G. margarita spore cell wall homogenates (B). Relative transcript abundance was normalized against 18S rDNA (18S). Bars represent sem.

