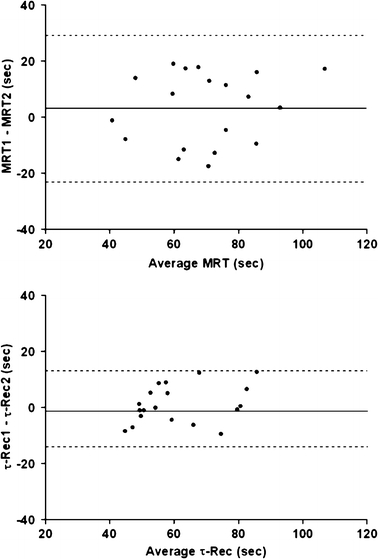
Fig. 2.

Bland Altman plots showing the difference of O2 kinetics between two constant-load tests during onset (upper graph) and recovery of exercise (lower graph), using an algebraic method and mono-exponential modeling with 5 breath sampling intervals, respectively. The solid lines represent the mean difference between the two tests, the dashed lines indicate the 95% confidence intervals of the difference. MRT mean response time. τ -Rec = time constant of
 during recovery with 5-breath sampling intervals
