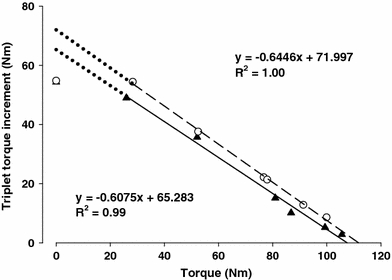
Fig. 2.

Torque increment as result of the triplet versus voluntary torque delivered at the 30° knee angle by a normal healthy subject in a pilot study. The empty circles denote the first day of testing, and the black triangles the second day. The dashed and solid lines represent linear regression fits for the data points on experimental days 1 and 2, respectively, excluding the resting triplet torque at 0 Nm. The resting triplet torque is clearly underestimated as it is very similar to the triplet torque increment at ∼30 Nm. The dotted lines represent backward extrapolation of the regression fits for both experimental days and illustrate the underestimation of the resting triplet torque as a result of tendon slack. For each experimental day, the respective equations and R2 values are shown. Using the interpolated twitch torque technique, voluntary activation (VA) is calculated to be quite high for experimental days 1 (84.4%) and 2 (94.7%)
