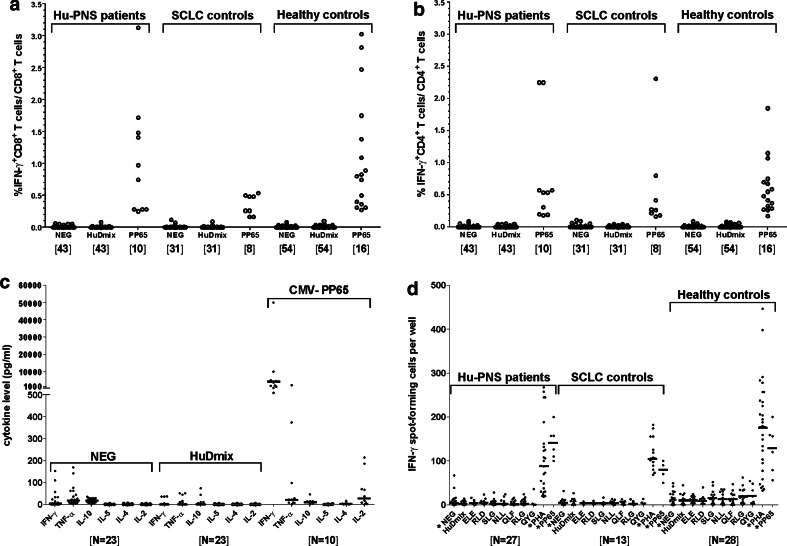
Fig. 1.
Cytokine production in response to HuDmix and HLA-matched HuD 9-mers. Proportions of CD8+ (panel a) and CD4+ (panel b) T cells expressing intracellular IFN-γ after stimulation with HuDmix in Hu-PNS patients, SCLC and healthy controls. Each dot represents the result observed in a single individual (panel c). After stimulation of PBMC with HuDmix and control antigens, the indicated cytokines were measured in assay supernatants. The results are shown for Hu-PNS patients only. Horizontal lines indicate median values of each group (panel d). ELISPOT assay showing the number of IFN-γ SFC after stimulation of 2 × 10⁵ PBMC with HuDmix or HuD 9-mers. Each dot represents the mean result of duplicates for each stimulus in each individual (panels a–d). Responses to CMV antigens are shown for CMV seropositive individuals only, as they were consistently negative in CMV seronegative individuals (not shown). The numbers of individuals tested are given in between brackets. NEG negative control (incubation without antigen), HuDmix HuD protein-spanning peptide pool, PP65 CMV pp-65 protein-spanning peptide pool, IL interleukin TNF tumour necrosis factor, IFN interferon, SFC spot-forming cell, PHA phytohemagglutinin. ELE, RLD, SLG, NLL, QLF, RLG and QYG designate individual HuD-based peptides

