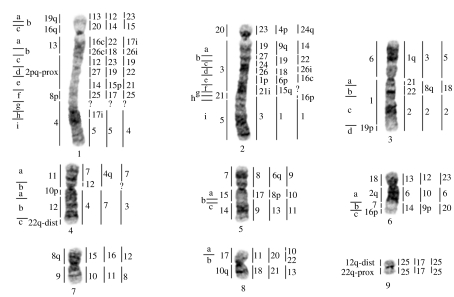
Figure 2.
G-banded autosomes of the aardvark, O. afer (2n=20), with regions of homology (right of aardvark chromosomes) delimited by FISH to the elephant, manatee and hyrax (from left to right). Syntenies that were unclear on direct comparisons but confirmed through multispecies comparisons are marked by ‘c’ and those areas inferred from multispecies comparisons by ‘i’. Question mark indicates chromosomal regions not resolved by cross-species painting. Correspondence with human chromosomes is shown to the left of the aardvark chromosomes and is taken from Yang et al. (2003a). Positions of breakpoints are indicated to the left of human and each subdivided region is marked (a–i).

