
Figure 6.
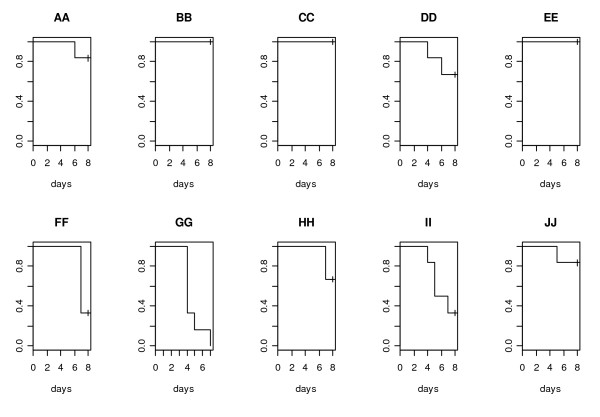
Differences in mortality. Kaplan-Meyer plots showing the differences in mortality induced by the 10 NTHi strains, PittAA-PittJJ. X-axis = time in days following inoculation; Y-axis percentage of surviving animals.
Official websites use .gov
A
.gov website belongs to an official
government organization in the United States.
Secure .gov websites use HTTPS
A lock (
) or https:// means you've safely
connected to the .gov website. Share sensitive
information only on official, secure websites.
Differences in mortality. Kaplan-Meyer plots showing the differences in mortality induced by the 10 NTHi strains, PittAA-PittJJ. X-axis = time in days following inoculation; Y-axis percentage of surviving animals.