
Figure 3.
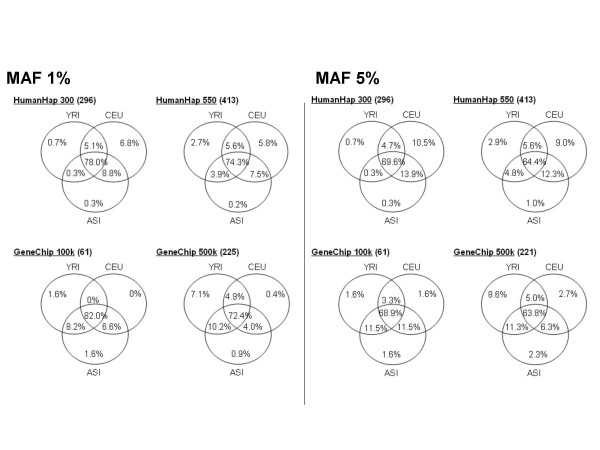
The number of commercial SNPs necessary to describe all SNPs in different populations. For each SNP in the commercial panels, we determined whether it was a tagSNP (the SNP with highest r2) for any marker in the selected population samples. For example, among the 296 SNP in HumanHap 300 with MAF 1% there were 231 (78%) SNPs that described SNP from all populations in these regions. Only 20 out of 296 (6.8%) were the best for describing the CEPH population and 2 (0.7%) were the best for describing only the Yoruban population. The analysis is based only on the two ENCODE regions in which the Estonian markers were genotyped.