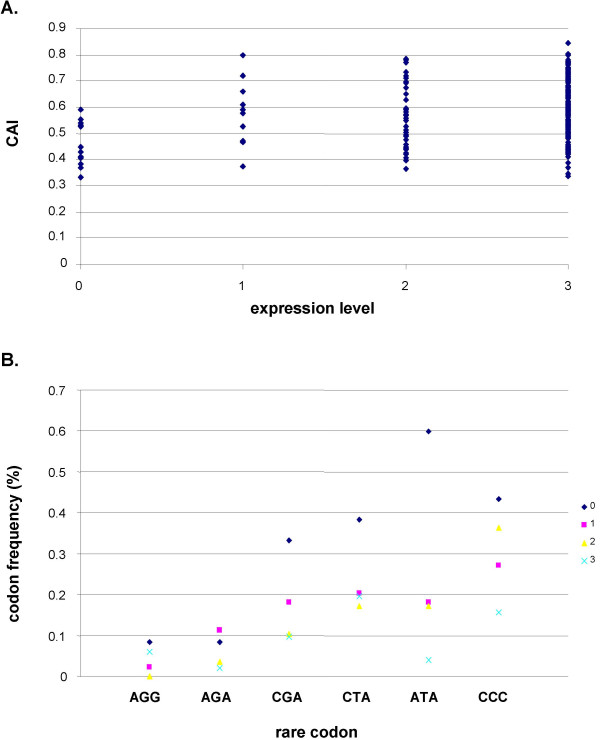
Figure 5.
Codon usage. A. Global analysis: The codon adaptation index (CAI) was determined for each protein, sorted by the level of expression. B. Analysis of 6 individual rare codons. 52 poteins were included: All 14 non-expressing proteins, all 10 proteins of low expression level, and a random choice of 14 proteins each of moderately and highly expressed proteins. The graph gives codon frequencies for each of the six codons in the total of codons in proteins of identical level of expression (no of codon X/total no of codons in proteins of expression group).

