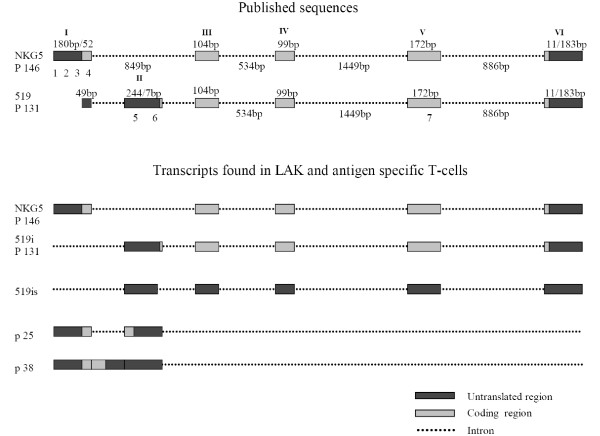
Figure 1.

Schematic view of known and found granulysin transcripts. Upper part of the figure shows schematically transcripts from GenBank and down part transcripts that were found in LAK or antigen specific T-cells. Black boxes indicate coding and gray boxes noncoding exon parts. Exons are marked with roman numbers. Dotted lines correspond to intron regions. Arabic numbers 1 to 7 stay for primers numbered in the same way as in Table 1.
