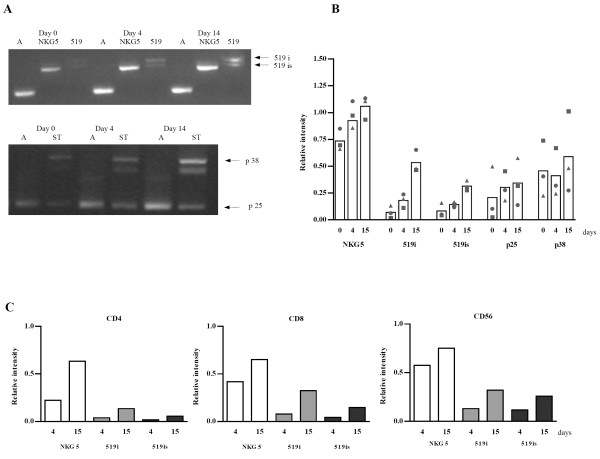
Figure 2.

Granulysin gene expression in LAK cells and different subpopulations. LAK cells were cultivated within 2 weeks under continuous IL-2 stimulation. At indicated time points cell samples were taken for RT-PCR analysis. Representative gel image shows transcripts present in LAK cells over the stimulation period (A). The same transcripts were found in different subpopulations (not shown). Graph (B) represents results of semiquantitative analysis of the transcripts normalized to actin (gel image, lines A) in LAK cells from three different donors. Each symbol represents one donor and bars correspond to the mean value. Graph (C) shows the same analysis in different subpopulations where one representative donor is shown.
