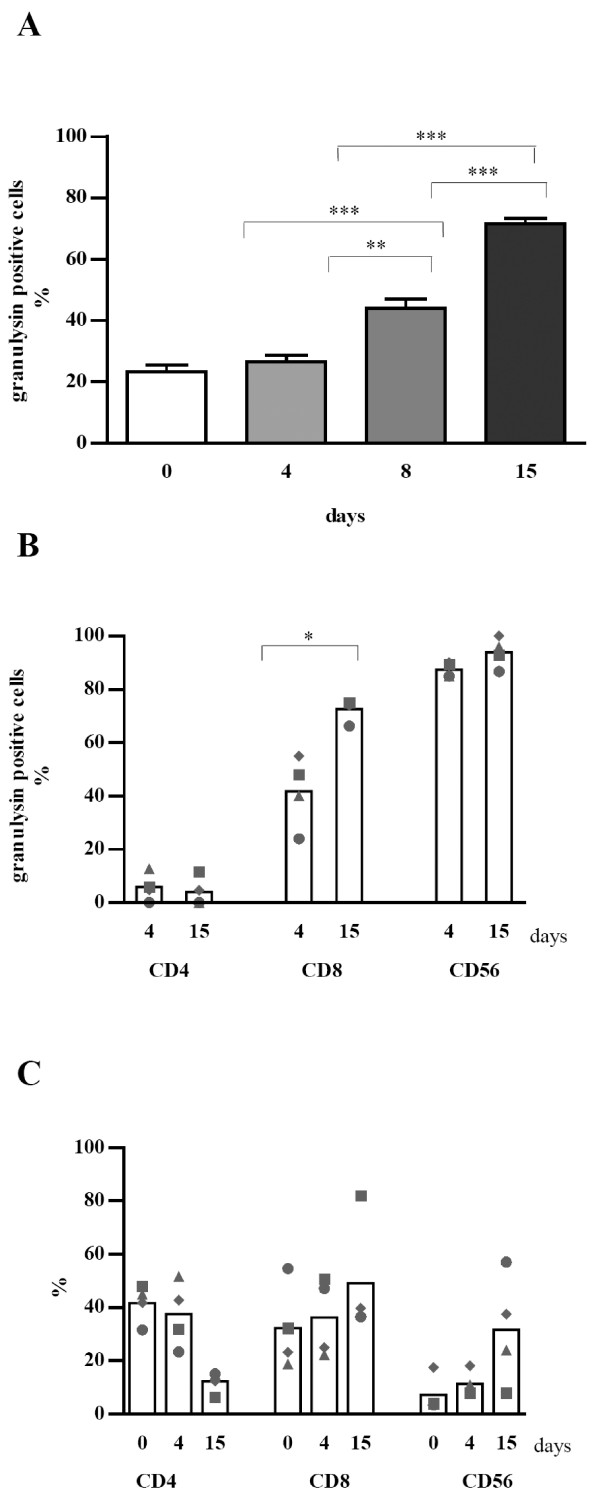
Figure 4.

Time dependent expression of granulysin in LAK cells and different subpopulations. LAK cells (A) or different subpopulations (B) were stained for granulysin and CD surface markers. Cells were analysed using confocal laser scanning microscope by counting 500 cells pro sample. Graph (C) represents phenotype analysis of LAK cells. Four different donors were analysed and each symbol represents one donor. Bars indicate mean values. (* p < 0.05; * * p < 0.005; * * * p < 0.0005)
