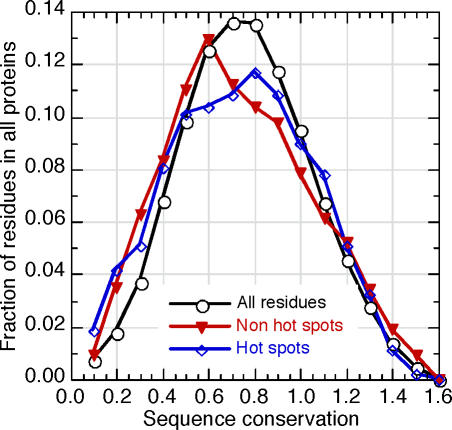
Figure 3. The Common Features of Hotspots Are Hard To Identify without Machine Learning.
Physicochemical, structural, and evolutionary features differentiate hotspots from other residues. However, while each of these features is crucial for the success of the prediction, a simple, linear combination of them will not suffice. The distributions of residue conservation (x-axis, HSSP [46] conservation score) are compared between the entire sequences of the proteins in the dataset (black circles), hotspots (blue diamonds), and residues with no effect (measured by alanine scans) on protein–protein binding (red triangles). The y-axis gives the fraction of residues with a given level of conservation. The differences are marginal, but the overall effect of conservation on the prediction is substantial.

