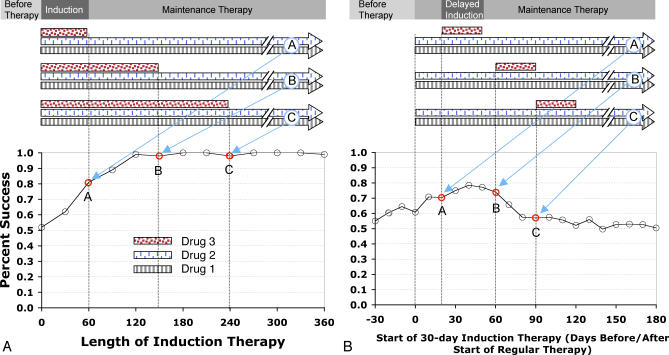
Figure 3. Schematic Illustrating Treatment Strategies Investigated in This Study.
(A) Effect of progressively longer induction regimens (circles A–C) on the likelihood of successfully eradicating viruses resistant to maintenance therapy under our canonical parameter set.
(B) Effect of altering the timing of induction therapy (circles A–C) relative to maintenance therapy on the likelihood of successful therapy.
x-Axis indicates duration of induction therapy in days (A), or interval between start of the induction and maintenance therapies, in days (B). Maintenance therapy is assumed to start on day 0. y-Axis indicates percentage of simulations in which viral load remained undetectable for at least 3 y after ending induction therapy.

