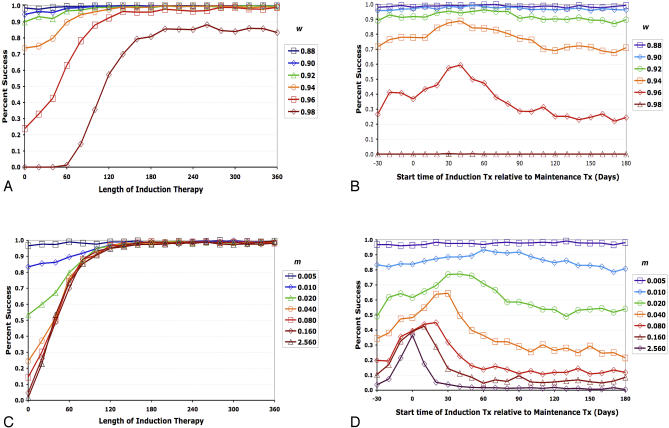
Figure 5. Computer Simulations Demonstrating Success Rates in Eradicating Viruses Resistant to Maintenance Therapy as a Function of Fitness Costs of Resistance and Turnover Rates of Target Cells.
(A,B) Effects of fitness (w) of resistant viruses in the absence of drug.
(C,D) Effect of target-cell death rates (m) (modeled here with simultaneous increases in k in order to keep pre-therapy viral load the same in each simulation).
(A) and (C) demonstrate success rates as the duration of induction therapy is increased, and (B) and (D) demonstrate success rates over a range of induction therapy start times. x-Axis indicates duration of induction therapy in days (A,C), or the interval between the start of a 30-d induction period and maintenance therapy in days (B,D). Maintenance therapy is assumed to start on day 0. y-Axis indicates percentage of simulations in which viral load remained undetectable for at least 3 y after ending induction therapy. Data in each panel were based on 500 replicate simulations. Interpretation: delaying induction therapy until after the start of maintenance therapy results in higher success rates. Under these conditions, starting a 30-d induction period after the start of maintenance therapy usually optimized the probably of success. Success rates decline as the fitness cost of resistance mutations decreases (w approaches 1) and as target-cell turnover rates (m) increase. The latter effect occurs because target cells necessary for the return of resistant virus rebound more rapidly after therapy at higher turnover rates.

